Day: January 4, 2011
Generative Media Networks: Fueling growth through action: Introduction
Strong digital media businesses fuel valuable activity across networks.
While the things that media organizations produce can define the brand, what happens as a result of producing an article, some data, a picture, a video, a package of stories, a sponsored message, a retail advertisement is what defines the value of the business.
In particular, it’s the generative media platforms that become the strongest.
This means that a platform benefits from the actions that their customers, participants and users take and then, crucially, reflects more value back out to them as a result of their actions, encouraging them to do more.
Those actions may be as simple as spending time with an article or buying a book, or it may be as complicated as managing a community or even campaigning for causes.
In the same way the reality of things observed are affected by the observer (ie “If a tree falls in a forest and no one is around to hear it, does it make a sound?â€) media businesses have a co-dependency with their customers.
For newspaper businesses, that co-dependency was traditionally managed through paper, trucks and newsstands in the past. Â Then in the early Internet years, most media brands’ web sites served merely as new access points, a co-dependence defined by the digital newsstand also known as Google.
The domain-as-distribution model works, but it is also incomplete and doesn’t embrace the larger powers inherent in networks.
The mesh-like characteristics of the Internet reward platform approaches to media, one where the actions of one node in the network can be interpreted by the platform as additive information for other nodes on the network to use.
How does a news-driven business operate in a network-shaped marketplace?
There’s a common model amongst many of the most successful Internet companies…they function as platforms for a network of activity.  As a result, all their moving parts and relationships resemble an ecosystem.
I’ll try to use this series to articulate what that looks like to me. Â It comes from a bit of experience trying to make such a thing work and from lots of observation across the market over a few years now.
In this case, I’m exploring how to tackle it from 3 different points of view.  I’ll start with some larger market context.  Then I’ll go into a more operational context, showing lots of examples. Finally, I’ll look at how the trajectory sheds light on what the future may hold for this model.
Where possible I’ll use examples from what we’re doing at the Guardian to illustrate what I’m talking about, but, to be clear, this is not a definitive strategy, by any means.  I’m posting it all here in hopes that others will chime in and help evolve the concepts further or show me better ways to think about this stuff.
This series is an attempt to assemble some ideas I’ve been exploring for a while. Â Most of it is new, and some of it is from previous blog posts and recent-ish presentations. I’ve split the document up into a series of posts on the blog here, but it can also be downloaded in full as a PDF or viewed as a sort of ebook via Scribd:
Generative Media Networks: Fueling growth through action: Modeling commercial success
Most media organizations measure success in terms of a cost model, a profit model, or a growth model. Â The key decisions are about either operating at peak efficiency, increasing revenue while decreasing cost, or acquiring more customers, respectively.
Actually, most media organizations operate along those three axes simultaneously and have one or two additional hooks that make them unique in their market.
However, there is another way to model success in the digital market.
If there’s one lesson to learn from the growth of social software it’s that value can be found in the relationships between people. Â The more relationships, the better. Â The more activity across those relationships, the better.
Social networks understand that there is value in each person in the network, but also, and perhaps more importantly, that there is value in the links between people, too.
They model success using graph theory.  A mathematical graph is “an abstract representation of a set of objects where some pairs of the objects are connected by links.”  This graph, for example, has 3 nodes and 6 edges: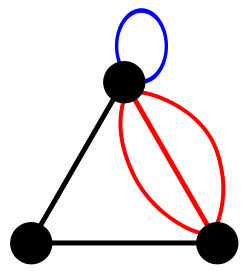 We’re all familiar with the Six Degrees of Kevin Bacon theory that any actor or actress can be linked through their film roles to Kevin Bacon within six steps.  This is a graph, too.
 What a media organisation needs to learn from this approach is which things need to be connected and how to fuel value in those relationships.
Importantly, the graph must be self-reinforcing. Â In other words, nodes in the network must benefit from both the existence of new nodes and activity along the edges between them.
One of the projects developed at the Guardian in a recent ‘Super Happy Dev Day’ (aka hack day) demonstrated how powerful a simple self-reinforcing graph can be. Â It’s called The Social Guardian.
After logging on with your twitter account, The Social Guardian will show you a page with 3 columns of content and some navigation. Â It includes the editorially chosen featured articles from the Guardian home page, a most recent articles list, and a list of articles other users are reading right now. Â The left-hand column shows you who is reading the site simultaneously with you, recommended articles based on what you’ve read , and a profile of topics it thinks you like.
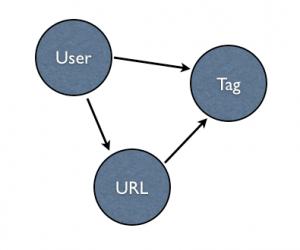
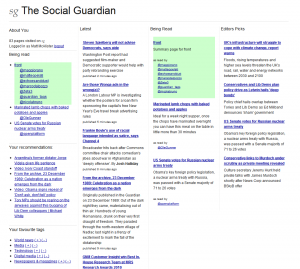 The Social Guardian backend is a very simple database of users, urls, and tags. Â Each user, url and tag is a node in the graph. Â There’s a simple directed graph that could be visualized like this:
If it also included each person’s social graph (all their friends and followers), then the recommendation capabilities could get even stronger.
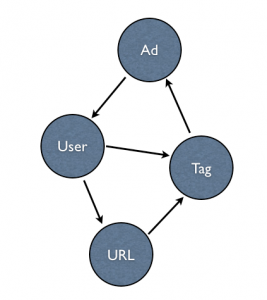
Of course, you can then imagine a very powerful ad platform optimised not only against the profile of users but also against both the live activity happening on the site and behaviors extracted from connected and other similar users.
Advertising becomes incredibly powerful when a system is optimized to match activity against marketing messages. Â The unique characteristics of this particular application are the individuals’ profiles, the content they are looking at and the live nature of the experience.
Therefore, the appropriate ad platform would offer advertisers the ability to target messages to users based on what their profiles say about them and to be able to adjust the content of the messaging based on what content the users are viewing…and to do it right now.
Clearly, the graph in this kind of model gets complicated very quickly. Â These nodes each grow massively. Â The edges have different value, and there are multiple edges between nodes.
This is one of the many reasons that the concept of an Active User is so useful. Â It gives the system permission to throw out any data it deems irrelevant after 30 days or to abstract the last 30 days’ data into smaller data chunks.
But let’s be real here, these are only some of the nodes a media organization cares about, and none of them are very clean and easy to work with.
- We have different concepts of what a user is, and users appear in many different ways to the business.
- Content used to be associated with a single canonical URL, but the influx of very small pieces of data and data within datasets make the concept of content much more complicated.
- Ad campaigns can come in all different shapes, sizes and values with different intents and purposes.
- Distribution platforms and digital products have different user experiences with different rules of engagement.
- The different sources of content will have different usage models to them. Â One of those sources is the user.
Trying to take all that into account becomes an incredibly challenging graph problem.
However, there’s a beauty in such a design which is that the edges convey an action. Â And those actions are where success will be discovered.
Success in a graph-centered media model is one where you can clearly measure the impact of the edges. Â Rather than think about increasing the size of the nodes, think about increasing the activity in areas that encourage the nodes to grow.
As the saying goes, “If you look after the pennies, the pounds will look after themselves.”
For example, rather than think about how to acquire new users and build the total user number up, the graph helps you think about what activities are going to encourage more users to participate.
If the system works better for each individual when each individual brings their friends along into the system, then the network will do all the work of building the user numbers up for its own selfish gain.
In the Social Guardian example, the incentive to encourage more users to join is natural. Â You want other people to bubble up interesting content for you, and you might like to read it along with them. Your experience gets better with more users, therefore you want to add users to the system.
Everyone wins.
And that’s the lesson: generative networks build value for all those who participate.
It works in lots of different contexts, and the media business is incredibly well suited for it.
Of course, publishers with open approaches to the network have an easier path toward generativity, but it’s certainly not limited only to those with open platforms.
As Steven Berlin Johnson once noted about the amazing power of Apple’s more closed ecosystem:
“…if you get the conditions right, a walled garden can turn into a rain forest.”
The key is to build generativity in the business model, a business architecture that creates value for everyone as opposed to the more simplistic industrial era give-and-take relationship with customers. Â Value must form as a result of more participants contributing more activity.
More specifically, advertising must match and relate to the activity happening across the system. Â Products offered for sale must add a layer of value on top of what’s possible within the network. Â Partners using the system must be able to profit while also adding value the system can’t otherwise offer on its own.
Crucially, the business must be open to giving away control to the participants in the platform, or it risks failing to be generative.
Jonathan Zittrain argues in his book “The Future of the Internet and How to Stop It” that openness is a prerequisite to generativity. Â Owners of generative platforms need to understand the impact of what they are doing and to act responsibly for future generations.
“the pieces are in place for a wholesale shift away from the original chaotic design that has given rise to the modern information revolution. This counterrevolution would push mainstream users away from a generative Internet that fosters innovation and disruption, to an appliancized network that incorporates some of the most powerful features of today’s Internet while greatly limiting its innovative capacity—and, for better or worse, heightening its regulability. A seductive and more powerful generation of proprietary networks and information appliances is waiting for round two. If the problems associated with the Internet and PC are not addressed, a set of blunt solutions will likely be applied to solve the problems at the expense of much of what we love about today’s information ecosystem. (p. 8)”
via David Weinberger
This series is an attempt to assemble some ideas I’ve been exploring for a while. Â Most of it is new, and some of it is from previous blog posts and recent-ish presentations. I’ve split the document up into a series of posts on the blog here, but it can also be downloaded in full as a PDF or viewed as a sort of ebook via Scribd:
Generative Media Networks: Fueling growth through action: Patterns to the future
Given the impressive rate of change happening in the digital market we have to consider how long this model will be relevant. Â Is it days, months, years, decades?
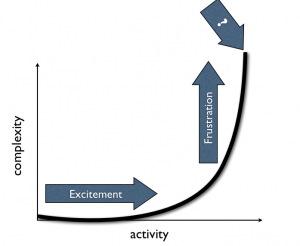
The repeating pattern in this market seems to be an exponential curve of exciting new activity that eventually results in overwhelming complexity. Â When the curve reaches a certain breaking point, instability reigns and new players suddenly enter the market.
John Battelle recently wrote about this idea in terms of “Signal, Curation, and Discovery.” Â He said:
“I have a new discovery problem: There’s simply too much content for me to grok. (For more on this, see Twitter’s Great Big Problem Is Its Massive Opportunity). Add in Facebook (people) and Google search (a proxy for everything on the web), and I’m overwhelmed by choices, all of them possibly good, but none of them ranked in a way that helps me determine which I should pay attention to, when, or why.
It’s 1999 all over again, and I’m not talking about a financing bubble. The ecosystem is ripe for another new player to emerge, and that’s one of the reasons I went to see the folks at Tumblr yesterday.”
Similarly, Amit Kapor of Gravity sees the pattern moving from ‘Their Web’ to ‘Our Web’ to ‘Your Web’ in a post called “The Future Will Be Personalized“:
“Once the web knows your interests, it can start to change… Any website or app can use knowledge of your interests in order to give you a personal experience.”
The new dominant players that break through during these unstable moments in the market seem to accomplish two things: 1) creating a new layer of activity that simplifies the complexity in the network, 2) commercializing access to or on top of that activity.
In the very early days of the web it was easy enough to find what you wanted just by clicking from page to page in your web browser. Â The web was a simple map of documents with hyperlinks.
But it didn’t take long for the number of documents on the web to explode.  Activity accelerated, and, as a result, soon the network became too complex.
The instability created opportunity which was captured in the form of a directory (among  other things).
What started literally as a list of links called Jerry and David’s Guide to the World Wide Web became Yahoo!, a directory that simplified the network for people.
The business model was very sensible. Â Yahoo! sold display ad units on their web pages which were relevant in the context of user’s actions…browsing for things.
By January 3, 2000 the company reached a market cap of $80 billion.
But the directory got full, and the Internet felt too big and complex again.
Then even Yahoo! couldn’t track everything being published on each web site across the whole network in a directory. Â More and more people arrived and more and more organizations and individuals published more and more documents.
The volume of information being published on the web went through another exponential growth curve. Â Too much activity resulted in too much complexity.
Google’s answer to simplifying the network won out by parachuting people directly into the page on a web site that had the information they wanted.  Of course, they also devised an ad platform to match people’s actions…ads targeted to those very specific search queries.
Subsequently, Google earned over $20 billion in revenue last year and currently have a market cap of $200 billion.
Activity across the network grew exponentially again.  In 2008, Google indexed over 1 trillion documents.  And, you know the story now, the increase in activity brought with it complexity.
Google began to struggle with maintaining a good search-to-result ratio, and the amount of activity happening online made findability a challenge again.
The next breakthrough to simplify the network came in the form of human filters.
People coopted other people to make the Internet feel more accessible again. Â The social filter changed the balance of power in our relationship with shared knowledge, and information felt like it began to find us.
Facebook and Twitter resolve this by reducing complexity and also benefitting from activity.
Just like its predecessors, Facebook has found ways to sell ads against these social filters by targeting ads in the context of people’s actions…sharing information.
Facebook will earn an estimated $2 billion in 2010 and has an estimated $50 billion market cap in secondary markets.
The social world has a lot of growth ahead of it, but this will change, too.
Not only will more people join the party, but more networks will get connected and dump large piles of information onto the Internet, not just simple documents. Â When more machines and devices flood the network including everything from phones to cars to household appliances the connected experience will become overwhelming and too complex yet again.
Your friends and family won’t be good enough at helping you to manage your experience.  The concept of a friend itself will get murky and overwhelm you with too many options.
We are now in yet another wave in the pattern, the exponential curve resulting from increasing activity online.
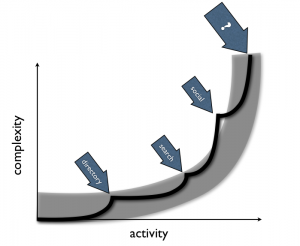
These waves appear to come in about 5 year increments, so it’s possible that the breakthroughs that will mark the end of this wave and the beginning of the next are either right in front of us today or just around the corner.
What kinds of breakthroughs will happen now?
I won’t answer definitively in part because I honestly don’t know but also because this is where invention happens.  Invention happens because humans solve problems with their own creativity, hard work and luck, not because markets predetermine what happens next.
On the other hand there are some healthy and very tangible conditions for change staring us in the face right now.
Smartphone apps, for example, are reducing the complexity of the network for people.  There’s a convenient business model for selling apps to people.  And the devices that distribute  apps are proliferating.
Smartphone makers shipped over 80 million smartphones worldwide in Q3 2010 which is actually up over 90% from a year ago.
Similarly, social activity online is changing the shape of the market.  The number of relationships we all have through all of our social apps and the amount of lifestream data we’re expected to catch is overwhelming.
Given the history of the network, it’s not likely that Facebook or Twitter are going to be able to solve the problem they are creating, just as Google and Yahoo! before them have so far failed to solve the problems they’ve created.
Might there be a pattern in the pattern?
Could it be that Yahoo!, Google and Facebook are all now contributing to a complexity problem in concert?  And, if so, then isn’t the next breakthrough one where the network itself is given a new lens through which to reduce the complexity that then benefits from activity?
Could the answer be about new visual languages and storytelling? Â reputation? Â hyper-distribution? Â data? Â all of the above?
…or perhaps even a total rejection of the network itself?
I would hate to see the anti-network movement prematurely subvert the potential of what is being accomplished today. Â But if it is an inevitable response to the network’s growth then I hope the characteristics of that movement are equally constructive and empowering.
Regardless, the trick to understanding meaning in the longer pattern whether its about language, devices, data, social activity, anti-networks or whatever is knowing your own context and where you want to go, what you want to be.
This series is an attempt to assemble some ideas I’ve been exploring for a while. Â Most of it is new, and some of it is from previous blog posts and recent-ish presentations. I’ve split the document up into a series of posts on the blog here, but it can also be downloaded in full as a PDF or viewed as a sort of ebook via Scribd:
Generative Media Networks: Fueling growth through action: Practical examples
Any good news organization knows how to use its brand and the media vehicles it owns and operates to both inform and influence. Â We’ve seen this up close on several occasions at the Guardian.
We’re learning how to inspire people through things that we don’t own and control now, too.
The great example is the Trafigura case.  Alan Rusbridger tipped the world via Twitter that there was a story we couldn’t tell, and the twitterverse came to our rescue, helping us to unveil the details we were prevented from sharing.
“Twitter’s detractors are used to sneering that nothing of value can be said in 140 characters. My 104 characters did just fine.
By the time I got home, after stopping off for a meal with friends, the Twittersphere had gone into meltdown. Twitterers had sleuthed down Farrelly’s question, published the relevant links and were now seriously on the case. By midday on Tuesday “Trafigura” was one of the most searched terms in Europe, helped along by re-tweets by Stephen Fry and his 830,000-odd followers.
Many tweeters were just registering support or outrage. Others were beavering away to see if they could find suppressed information on the far reaches of the web. One or two legal experts uncovered the Parliamentary Papers Act 1840, wondering if that would help? Common #hashtags were quickly developed, making the material easily discoverable.
By lunchtime – an hour before we were due in court – Trafigura threw in the towel. The textbook stuff – elaborate carrot, expensive stick – had been blown away by a newspaper together with the mass collaboration of total strangers on the web. Trafigura thought it was buying silence. A combination of old media – the Guardian – and new – Twitter – turned attempted obscurity into mass notoriety.”
The combination of our work and what other people do creates a very powerful bi-directional relationship.
However, there are different aspects to this relationship…the things that we work with (words, pictures, software, paper, etc.) and the ideas that we work with (stories, insights, opinion, facts, etc.).
The things are the ways we all express ourselves and transfer something from one person to the next, the tangible ouputs.
The ideas are the meat, the knowledge and intents that we all use to make decisions about our world.
We can then think about what we do as a business in terms of fueling a news media platform, a self-reinforcing ecosystem, a generative network where we use what we know to make things that people use and act on subsequently improving what we know…the cycle then continues and evolves.
Our operational model then falls into four areas:
- Things that we make.
- Things that people use.
- Ideas that people share.
- Ideas that we evaluate.
 Here are some things that we are doing now at the Guardian in each area.
MAKE
Most of our output falls into this category. Â We write articles, edit a newspaper, post to liveblogs on the web site, etc. Â We design and package things. Â We make apps.
Using the lens of mutualization we can also see some very progressive approaches to what we make.
One of the strengths of the Open Platform is our plugin architecture we call MicroApps. Â This allows us to work with independently operating services that can exist anywhere on the Internet and integrate them seamlessly into Guardian digital products.
We’ve used the MicroApp framework to work with partners such as WhatCouldICook.com who built a wonderful recipe search that now exists both on guardian.co.uk and on whatcouldicook.com.
We’ve also used the framework to develop some new sponsorship approaches.  We built a crowdsourced ‘interesting places’ app with the tourism service Visit England.  It runs both on guardian.co.uk and the EnjoyEngland web site.
 Success is easier to measure in this category than the others.  It’s mostly a cost center.
These are the kinds of results we would like to see:
- We make things quickly and cheaply
- The things we make perform well, have acceptable errors
- We make interesting, creative, groundbreaking things
- Our work is of a high standard, considered better than most competitors
- The amount of what we produce is sufficient for demand
We can also measure our success in terms of the work our partners are doing when we co-create.
USE
Every publisher has circulation and marketing teams that find ways to encourage use of the things we make. Â We want people to buy our newspaper and to visit our web site.
We also want to distribute our work through partners of various sorts. Â This is what the syndication business has been doing for years.
The production-consumption relationship can now benefit from the power of the network and ‘hypercharge’ syndication with things like APIs and RSS feeds, for example.
One of the most interesting examples of this in my mind is the Guardian WordPress plugin. Â Anyone who blogs can get a feed of Guardian articles pumped directly into their site, and they can then choose which articles they want to republish.
 As Mike Smith said,
“If content is king, then this is service is a hundred of the king’s best horses, and thousands of his best messengers, sending the Guardian far and wide.”
We’ve also seen some incredible work by people using the data we’re publishing as part of the news cycle in the Data Store. Â There are hundreds of people posting images of ways they are using that data on a group on Flickr.
 Success in this category is easy to measure using some more traditional metrics and a few new ones.
Again, here are the kinds of results that would indicate success:
- People buy our paid-for products, and we make a profit on those products
- People see our free products, and we receive a high value subsidy for that
- People dive into our products and spend time with them
- Partners are using our stuff, and they are making money as a result
- Our partners offer successful paid and free things by using our stuff
- People buy access to our people, processes, platforms, partners
- Our market share in all the things we offer is strong
SHARE
It used to be that once our work made it into our customers’ hands we had very little idea what happened to it.
The Internet changed all that, too. Â People tell their media sources exactly what they think about what they produce. Â And they also tell all their friends in massively distributed public spaces.
What’s clear from examples like Trafigura, people want to share their thoughts. Â The tools to do so are getting better and better all the time, so why not fuel that activity?
Twitter has become a sort of extension of our brains, but we’re also creating very simple ways for people to share their thoughts and to socialize with the news. Â For example, during the TV debates for last year’s UK general election, we posted a ‘Reaction Tracker’ so that people could vote positively or negatively to things the politicians were saying them…as they were saying them on TV.
The lines you see in the chart below formed in realtime as the debate unfolded and were visible to everyone who visited the Guardian home page during the 90 minute debate.
![]() We’ve also embraced expert voices from around the world to participate with their contributions directly to the Guardian platforms. Â We have developed several blog networks in addition to Comment Is Free which has become a very rich conversation platform in its own right.
We’ve also embraced expert voices from around the world to participate with their contributions directly to the Guardian platforms. Â We have developed several blog networks in addition to Comment Is Free which has become a very rich conversation platform in its own right.
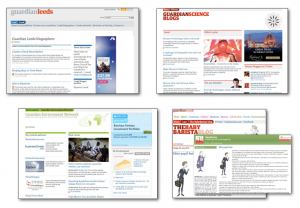 Success in this area may feel a little more fuzzy, but there are some obvious metrics that social businesses tend to use.
These are the kinds of things that we would like to see happen:
- People both implicitly and explicitly indicate interests in things
- They spread our work through their social nets. Â Their social actions result in more actions from those connections.
- They participate in conversations we trigger and add to them with their ideas, both within and away from our products.
- They actively contribute by giving or selling us material to evaluate and then make things
- Things change in the world as a result of our work and the impact of our readers, users, and partners acting on it
EVALUATE
Research and investigation got much easier as the Internet increased the speed, access and volume of information available to all. Â Among the many things it did, the web made it easier to locate details and contacts.
These benefits also flattened the competitive field.
Not unlike the religious leaders who originally controlled the printing presses, many media organizations resisted acknowledging the value of the participants in new media doing similar work.
Rather than hide behind a thin veil of authority and broadcast knowledge, the best journalists mine the activity happening at the center of a story or an issue to improve their understanding of what’s going on wherever that activity is happening.
Of course, nothing beats a great contact at the heart of a story willing to share information exclusively, but capturing those signals at scale is getting easier as a result of the interconnectedness of the social web.
There are insights to be gleaned from social activity happening on Facebook and Twitter, expressed via Google Trends, and posted on blogs and photo sharing services everywhere.
We actually have our own firehose of news signals gushing out of our Apache referral logs.
Media businesses that embrace what’s happening across the network and even enable more useful activity to happen will be more effective in evaluating important information.
They will get a first look. Â They will have more inputs to choose from. Â They will be able to construct stronger outputs.
This happens when excellent investigative reporting surfaces important stories as David Leigh and Nick Davies have done with WikiLeaks.
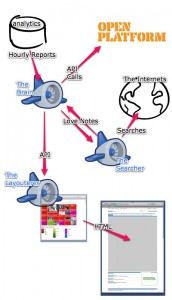
It can also happen systematically with things like Dan Catt’s Guardian Zeitgeist which captures activity signals from the web to present a different view of what Guardian articles people find interesting.
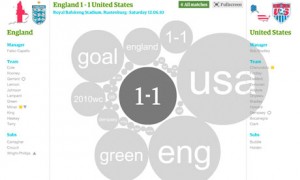
 Alastair Dant’s World Cup Twitter Replay animations are fascinating in the way they help you relive a match through the eyes of twitter…bubbles of words World Cup watchers were tweeting grow and shrink in response to each match, as if you are watching the match with everyone again rather than being the recipient of a leanback-style highlights package.
 Lastly, our data journalism work such as the recent government spending search tool demonstrates very clearly where the future of all of this is going.
With Simon Rogers leading the way, a small team of developers built a search interface to an otherwise completely unwieldy database. Â We published the tool and kicked off a liveblog to cover activity as it was happening throughout the day.
We received several emails from people digging through the data, including one user who discovered that the cost to the taxpayer of flying the British flag is nearly £100k.  It would’ve been hard for the person who found that data to get a response from the government as to why this is, but our reporter Polly Curtis was able to get a statement from the Department for Culture, Media and Sport, even if it was a bit unsatisfactory.
 Again, how do we measure success in this area?
It’s a matter of tracking some of the basic functions of journalism but doing it in a way that scales and takes into account the activity happening around us whether we have been seeking it out or not.
These would be some of the kinds of results that indicate we’re doing well in this area:
- We see important trends early, generally before the competition
- People with important information share it with us directly
- We are good at verifying information, recognizing it’s value and knowing what to do with it
- We are honest and fair in our assessments, and the market validates that view
- We are accurate and truthful by most objective standards
Measuring success with metrics
By isolating the activity happening in each area of the business in this way the metrics required to understand success and therefore to make decisions might look something like what’s below here.
And to be clear, these aren’t our metrics at the Guardian but rather a strawman for how one would think about applying real numbers against this strategy:
MAKE
- Time to develop, number of people involved
- Real cost of development
- Ease-of-use, performance and errors
- Aesthetic appeal
- Strengths against competition
- Weaknesses against competition
USE
- Number or amount of things produced
- Number of people using each thing
- Number of repeat uses
- Amount of time spent
- Breadth and depth of usage
- Supply vs capacity ratio
- Number of things purchased
- Amount received from buyers
- End-user response to promotions
- End-user conversion rate on promotions
- Amount received from advertising promotions
- Number of partners using our stuff in their stuff
- Revenue partners are earning from using our stuff
- Amount partners are spending to use our stuff
- Market share: end-users
- Market share: partners
SHARE
- Implicit interests collected from end-users
- Explicit interests collected from end-users
- Number of shares (tweets, RT’s, likes, mailto’s, etc.)
- Number of referral URLs posted
- Number of clicks from shares and referrals
- Number of comments within our stuff
- Number of comments elsewhere as a result of our stuff
- Quality of insights from comments
EVALUATE
- Number of articles/posts/pictures/video pitched to us
- Cost of acquiring articles/posts/pictures/video, etc.
- Amount of information intake
- Cost of data analysis on external inputs
- Success rate in surfacing strong signals in the data
- Low failure rate: verifying information
- Low failure rate: accuracy
When tracking performance indicators across all these areas, it becomes very easy to then understand what is going well and what isn’t.  Different metrics have different values in different contexts, but one could roll everything up into a framework that helps with decision-making.
For example, here are two imaginary products or features or story packages or any ‘things’ produced and measured using this approach compared back-to-back.
For the sake of argument, I’m contrasting a well-crafted digital product with modest commercial outcomes against an innovative but faulty experiment that inspires a lot of interesting activity.
Again, it would be a mistake to take this approach too literally, as it’s merely a tangible way to reflect the model I’m talking about here.
You can imagine the model working to both narrow the scope of what media businesses spend resources developing and also how the commercial model becomes a sort of fuel for making the ecosystem generative.
Products are then built to capture traditional revenue streams, but they also get built because they will have impact and create measurable and real value for the network.
Of course, stating that things must be built with the intent of creating value across a network is much easier said than done. Â We have to look toward some of the pioneers in this area to get a better idea of how to apply those concepts.
This series is an attempt to assemble some ideas I’ve been exploring for a while. Â Most of it is new, and some of it is from previous blog posts and recent-ish presentations. I’ve split the document up into a series of posts on the blog here, but it can also be downloaded in full as a PDF or viewed as a sort of ebook via Scribd:
Generative Media Networks: Fueling growth through action: What it means for journalism
Market context may seem far away to when you’re reporting and editing the news every day, building web pages, writing code, selling display ads, presenting marketing plans, managing managers, etc.  But, equally, failing to recognize when market conditions are affecting you and your company is a sort of occupational hazard.
Let’s get to the real question: “What is different today?â€
Where media businesses once believed that winning digitally meant attracting eyeballs to web pages today there’s a greater understanding about the role of the various platforms around the network and the value of the network itself.
This blog post from Jeff Jarvis articulates the idea well:
“In the new distributed world you want to be where the people are…The media brand is less a destination and a magnet to draw people there than a label once you’ve found the content, wherever and however you found it.â€
This is very much the kind of thinking that inspired the Open Platform.
The Open Platform is the suite of services that enable people to build applications with the Guardian. Â We have a Content API that gives people access to republish Guardian content. Â The Data Store offers raw data for people to download and reuse. Â Our Politics API is an open database of candidates, voting records, election results, etc. Â And, finally, the MicroApp framework is a plugin architecture for integrating apps built by partners and our own teams into our platform.
What this platform enables is a different kind of relationship with everyone and everything around us.
Whereas the pre-internet newspaper world looked like a one-way relationship, the new era is one where we grow as others grow, a circular relationship, a self-reinforcing marketplace.
Increasing bi-directionality through mutualization
Alan Rusbridger has given a couple of fantastic speeches this year that put more perspective around this philosophy.  Of the many quotable passages in the Cudlipp Lecture from January 2010, Alan says,
“Our most interesting experiments lie in combining what we know with the experience of the people who want to participate rather than passively receive.â€
He refers to some wonderful imagery by Andrzej Krauze, the first depicting a staff of journalists chucking newspapers over a wall to people scampering about madly, the second of two men standing nose-to-nose with a hole through the newspaper as if the journalist and reader are both uncomfortable with their proximity.
Alan is embracing “mutualisationâ€, breaking down the wall between publisher and reader, reinforcing the strengths of ideas through collaboration, making a greater impact by working together.  It’s an approach to social media that has a clear intent.
There are many many approaches to evolving journalism in this new world, and we therefore must get back to some basics and consider what it’s for.  I think Jay Rosen is often very insightful in this context.  He recently said:
“Journalists should describe the world in a way that helps us participate in political life.”
On a macro level, journalism should inspire people to change the things that they can change or at least to understand what it is that they are accepting that won’t change as a result of inaction.
On a tangible level, the results of good journalism mean that people read, watch, think, talk, write, participate, help, challenge…that people do things.
The commercial intent is the same, of course. Â The media business wants to inspire people to explicitly show interest in things, to promote things, to sell things, and to buy things.
If a media organization can make a virtue of inspiring action across all the things that it does, empowering people to do things, whether as individuals or as groups and organizations, then more people will want to participate and partner, building more value for everyone…creating a generative media network.
To be clear, this approach mustn’t be mistaken for advocacy journalism.
Time spent, referral activity, sharing and re-use, commenting, and response can all be used to measure what kind of actions result from a story without threatening a journalist’s independence from external influences, either political or commercial.
Equally, spaces must exist for biases to be expressed. Â This is particularly important when there’s an expectation to form a relationship with people.
At the Guardian, our future is dependent on trust, on our ability to produce insightful, responsible, and accurate information.
We can wrap general editorial policies and standards around our work to reinforce that trust, but we must also make extra efforts to ensure people don’t misinterpret any biases and feel deceived as a result.
As Jonathan Stray blogged recently:
“Journalism has no theory of change — at least not at the level of practice.  I’ve taken to asking editors, “what do you want your work to change in society?â€Â The answer is generally along the lines of, “we aren’t here to change things. We are only here to publish information.†I don’t think that’s an acceptable answer.
Journalism without effect does not deserve the special place in democracy that it tries to claim.â€
The core mission of the news business is still about good journalism. Â It always will be.
The business side of the house needs to worry less about controlling how journalism is delivered to people and more about what people do as a result of it affecting them…and, crucially, that it is, in fact, affecting people.
This series is an attempt to assemble some ideas I’ve been exploring for a while. Â Most of it is new, and some of it is from previous blog posts and recent-ish presentations. I’ve split the document up into a series of posts on the blog here, but it can also be downloaded in full as a PDF or viewed as a sort of ebook via Scribd:
Generative Media Networks: Fueling growth through action: Market context
What’s happening in the world that defines the wider context for news ecosystems?  What do we know about how the world is moving and where it’s going that can create some clarity on a more tangible level.
The more obvious techtonic shifts affecting us all across the market include things like:
- The increasing numbers of people going online globally
- Increasingly easy and more powerful software tools for creation and ongoing industry standards battles
- The changing distribution methods, including increasingly influential nodes in the network or “points of controlâ€
- Tighter relationships between the network and real world things and vice versa
- Cashflow paths moving online, new streams of revenue and old streams reinvented
- Human behaviors, new norms, real cultural shifts
- New regulation, industry decision-making and the long view of rules
The people, companies, technologies, economics and social issues are going through massive change. Â The intensity across the space is incredible, in some cases expressed through exponential growth curves.
The proven models for success online tend to embrace the whole network as the medium.  The global network itself is the distribution platform.  The network is the market, the medium, the space in which we’re doing our jobs every day.
Why does the network-as-marketplace matter? Â Here are a few reasons that publishers must consider:
First, competing on audience is very hard.
As a news business, we are simultaneously competing on a finite number of newsstands against a limited number of newspaper publishers in one kind of market and a completely different digital market where everyone in the world has equally easy access to every other news publisher in the world.  The Guardian is doing very well on that shelf space.  guardian.co.uk served more than 40M users in November 2010.  But that’s a fraction of what many on this same shelf space are achieving.
ComScore reported that the Top 5 “Properties†in the US each had well over 100M unique visitors in November 2010, all of the top 50 well over 20M.  That’s just their US traffic.  Most of them have strong international audiences, too, inflating those numbers even higher.
Even more dramatic are the numbers powering the ad networks. Â ComScore reported that the Top 50 Ad Networks all reached well over 100M uniques in November 2010.
Distributed platforms are winning the pursuit for eyeballs with and without the help of big ‘properties’.
That’s not to say that such a pursuit is fruitless.
I can’t seem to find any current numbers on total Internet population, but as of December 2008, comScore was reporting that the total number of people online in the world had reached 1 billion.
One billion!  Wow, that’s a lot.
Yet, it’s not.  That means only 15% of all people are using the Internet.  Any ambitious entrepreneur sees big opportunity in numbers like that.
Not everyone sees the opportunity in developing new web sites, though.
Chris Anderson of Wired Magazine posited that the opportunity wasn’t on the web at all, that the web we get via web browsers was in fact dying. Â In his view, the world of apps and devices was changing the shape of the digital media opportunity and that the Web was actually beginning to fail as a platform.
It’s a very thought-provoking hypothesis.
The Internet didn’t like Anderson’s idea, and the opposing arguments appeared instantly.
It turns out that Anderson’s premise was built on bad data.
Sure, the activity on the web has been shrinking as a percentage of all activity on the Internet.
But all activity on the Internet has been growing exponentially, including all the web-based activity. Â The growth rate of video and P2P activity has been mindblowing over the last 2-3 years, but so has activity on the web.
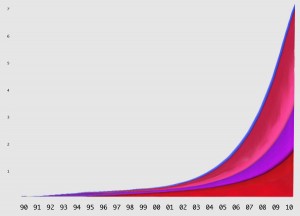
The growth is so astounding, actually, that it’s worth considering some hard questions:
- What exactly have we changed in the last 2-3 years to be a part of that growth?
- What’s different about what we do today compared to 2-3 years ago?
- Are we part of that growth, or are we merely benefitting from the normal usage curve that results from more people joining the network?
Leading indicators
Going back up to the list of techtonic shifts, the number of people online is clearly affecting this growth. Â The software for publishing is getting better and more accessible. Â Blogging and messaging platforms, CMS tools, network-based social products, and photo and video sharing sites are bringing creation to the masses.
Google’s search index boasted over 1 trillion documents way back in 2008.  Twitter, Facebook and new players like Tumblr have all seen exponential growth curves, too.
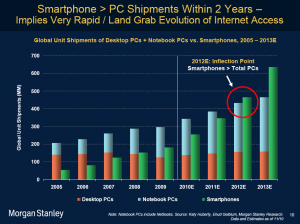
It’s not just the big dotcom media space that’s popping.  Mary Meeker’s wonderful Web 2.0 Summit slides show the dramatic increase in smart phone shipments and the possibility of those shipments eclipsing PCs in the next 2 years.
If that weren’t enough, the money is really flowing, too.
E-commerce sales will represent 8 percent of all retail sales in the U.S. by 2014, growing to $250 billion, according to Forrester. Â For example, GroupOn, which seemingly came out of nowhere, now earns $800 million, according to several sources, and it’s growing toward $2 billion.
Are we in the middle of a perfect storm? Â What does it mean?
This series is an attempt to assemble some ideas I’ve been exploring for a while. Â Most of it is new, and some of it is from previous blog posts and recent-ish presentations. I’ve split the document up into a series of posts on the blog here, but it can also be downloaded in full as a PDF or viewed as a sort of ebook via Scribd:
Generative Media Networks: Fueling growth through action: Conclusion
The existential discussion often percolates when the challenges ahead seem overwhelming. Â In the face of such a daunting task there’s a natural tendency to question why we’re doing what we’re doing.
Fortunately, the Guardian has a mission much larger than itself and a funding mechanism that supports its goals in the form of the Scott Trust:
“The Scott Trust was created in 1936 to safeguard the journalistic freedom and liberal values of the Guardian. The sole shareholder in Guardian Media Group, its core purpose is to preserve the financial and editorial independence of the Guardian in perpetuity, while its subsidiary aims are to champion its principles and to promote freedom of the press in the UK and abroad.â€
It doesn’t take long to work out why we’re here when you understand the Scott Trust.
The harder question isn’t “what’s the point?† The harder question is “what are we going to do about it?â€
In today’s connected world, media organizations need to measure success by the value of the actions they influence on and across the nodes in the network.
First, we must inspire people to do things, meaningful things, useful things.  Without triggering a spark of some sort we’re merely shouting into the abyss.
Then we must improve and benefit from the activity happening around us…the things we make, how people use them, what ideas people are sharing and contributing, and our ability to evaluate what’s happening.
The circle must complete itself and begin to bloom into its own self-reinforcing network of activity.  That’s when the brand reaches hearts and minds, when journalism impacts what’s happening in the world and gives power to the voices and ideas that matter, that the business earns real, meaningful, sustainable income to support the organization into the future.
Conversely, the cost of failing to inspire people into action is worse than losing money…it’s becoming irrelevant.
The beginning all over again
In his 2006 book “The Wealth of Networksâ€, Yochai Benkler explained what kinds of changes we’re experiencing right now living and working in a networked information economy and what they mean for individuals and society as a whole:
“A series of changes in the technologies, economic organization, and social practices of production in this environment has created new opportunities for how we make and exchange information, knowledge, and culture.
These changes have increased the role of nonmarket and nonproprietary production, both by individuals alone and by cooperative efforts in a wide range of loosely or tightly woven collaborations.
These newly emerging practices have seen remarkable success in areas as diverse as software development and investigative reporting, avant-garde video and multiplayer online games.
Together, they hint at the emergence of a new information environment, one in which individuals are free to take a more active role than was possible in the industrial information economy of the twentieth century.
This new freedom holds great practical promise: as a dimension of individual freedom; as a platform for better democratic participation; as a medium to foster a more critical and self-reflective culture; and, in an increasingly information dependent global economy, as a mechanism to achieve improvements in human development everywhere.â€
Mark Zuckerberg made a slightly more concise but similarly inspiring comment in his interview at Web 2.0 Summit this year that speaks volumes about why journalists and everyone in the business of media should be very optimistic about the future.
There was a giant map on stage that was used as the symbolic backdrop for the whole dialog at the event. Â The intent of the map was to show how the various players in the market were occupying and competing in different ways…it was titled “Points of Control: The Battle for the Network Economy“.
Mark walked on stage, sat in the interview chair, looked behind him and said:
“Your map is wrong.  I think that the biggest part of the map has got to be the uncharted territory. Right?
One of the best things about the technology industry is that it’s not zero sum. This thing makes it seem like it’s zero sum. Right? In order to take territory you have to be taking territory from someone else. But I think one of the best things is, we’re building real value in the world, not just taking value from other companies.â€
This series is an attempt to assemble some ideas I’ve been exploring for a while. Â Most of it is new, and some of it is from previous blog posts and recent-ish presentations. I’ve split the document up into a series of posts on the blog here, but it can also be downloaded in full as a PDF or viewed as a sort of ebook via Scribd:

