Dispatchorama: a distributed approach to covering a distributed news event

We’ve had a sort of Hack Week at the Guardian, or “Discovery Week“. So, I took the opportunity to mess around with the n0tice API to test out some ideas about distributed reporting.

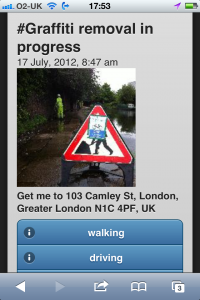
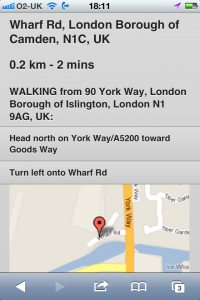
This is what it became (best if opened in a mobile web browser):

http://dispatchorama.com/


It’s a little web app that looks at your location and then helps you to quickly get to the scene of whatever nearby news events are happening right now.

The content is primarily coming from n0tice at the moment, but I’ve added some tweets with location data. I’ve looked at some geoRSS feeds, but I haven’t tackled that, yet. It should also include only things from the last 24 hours. Adding more feeds and tuning the timing will help it feel more ‘live’.

The concept here is another way of thinking about the impact of the binding effect of the digital and physical worlds. Being able to understand the signals coming out of networked media is increasingly important. By using the context that travels with bits of information to inform your physical reality you can be quicker to respond, more insightful about what’s going on and proactive in your participation, as a result.

I’m applying that idea to distributed news events here, things that might be happening in many places at once or a news event that is moving around.

In many ways, this little experiment is a response to the amazing effort of the Guardian’s Paul Lewis and several other brave reporters covering last year’s UK riots.

There were 2 surprises in doing this:

  1. The twitter location-based tweets are really all over the place and not helpful. You really have to narrow your source list to known twitter accounts to get anything good, but that kind of defeats the purpose.
  2. I haven’t done a ton of research, yet, but there seems to be a real lack of useful geoRSS feeds out there. What happened? Did the failure of RSS readers kill the geoRSS movement? What a shame. That needs to change.

The app uses the n0tice API, JQuery Mobile, and Google’s location APIs and a few snippets picked off StackOverflow. It’s on GitHub here:
https://github.com/mattmcalister/dispatchorama/

Local community data reporting

EveryBlock has taken a very data intensive look at local news reporting. As founder Adrain Holovaty explains:

“An overall goal of EveryBlock is to point you to news near your block. We’ve been working hard to do a good job of this so far by accumulating public records, cataloging newspaper stories and pulling together various other geographic information from the Web.”

This generally takes the form of raw data points placed on maps. They recently rolled out a variation on the theme by using topic-specific data which adds more context to the local news reporting idea.

“A week or so ago, 15 people were arrested on bribery charges as part of a federal probe into corruption in Chicago city government. We’ve analyzed U.S. Attorney Patrick J. Fitzgerald’s complaint documents and cataloged the specific addresses mentioned within. On the project’s front page, you can view every location we found, along with a relevant excerpt from the complaint. You can sort this data in various ways, including a list and map of all the alleged bribe locations.”

This is the type of value that’s otherwise kind of missing from the experience. Rather than providing a mostly pure research tool, the site now gives some insight and perspective with an editorial view on the data. In this case, the data is telling a story that otherwise might seem a little distant to you until you see how the issue may in fact be a very real one right in your backyard, so to speak.

But it occurred to me that the community is probably even better able to capture and share this level of useful insight. It would be really neat to see EveryBlock open the reporting and mapping process so that anyone who has an interest in exposing the trends in their neighborhood or elsewhere had a platform to do so.

Average payment (€) by Area
Similar to the way Swivel allows you to collect data in spreadsheet form, visualize it and then share it the way Flickr and YouTube allow you to share, EveryBlock could provide an environment for individuals to do the reporting in their neighborhood that matters to them. The wider community could then benefit from the work of a few, and suddenly you have a really powerful local news vehicle.

This isn’t necessarily in contrast to the approach Outside.in has taken by aggregating shared information from around the web, but it certainly puts some structure around it in a way that may be necessary.

Managing a community is a very different problem than aggregating and presenting useful local data. But I wonder if it’s a necessary next step to get both of these fledgling but very forward-thinking local media services closer to critical mass.

Interesting perspectives from Web 2.0 Expo

Today’s Web 2.0 Expo in San Francisco provided some really good brain food.

Clay Shirky’s keynote was excellent. He talked about architecting a new world for the “cognitive surplus” that’s emerging as people pull themselves out of the historical sitcom hangover and invest their energy online. Matt Jones and Tom Coates shared some neat ideas on design for personal infomatics. And Twitter’s Alex Payne and Michael Migurski of Stamen Design presented learnings from the perspective of an API provider.

One little nugget I really liked was a minor point Migurski made when talking through the Oakland Crimespotting service. He noted that there are several standard formats commonly provided by most web services including HTML, JSON, serliazed PHP, RSS and XML.

But we often forget about simple Excel spreadsheets.

He showed how the Oakland Crimespotting site offers downloadable Excel spreadsheets detailing recent activity from particular police beats, for example.

One of the keys to opening up government data is making the case to the people who are best equipped to provide raw data that it needs to be posted directly to the Internet. Telling them they need to output JSON for data visualizations and mashups will do as much good as a slap in the face. Showing them a regularly updating Excel spreadsheet that is findable on a web page that they can email to their colleagues, friends and families is going to get them thinking differently and perhaps encourage their participation directly.

The crime data issue is going to be a big deal in the not too distant future, I’m sure. And as Mr. Coates and Mr. Jones noted in their talks on personal data design, it’s the details that really matter in this space. You can think about products and features all day, but the specifics that define how data is shared, how it becomes relevant and how it is presented will make or break the intent of any offering.

Designing Your API, Web 2.0 Expo 2008:

Creating leverage at the data layer

There’s a reason that the world fully embraced HTTP but not Gopher or Telnet or even FTP. That’s because the power of the Internet is best expressed through the concept of a network, lots of interlinked pieces that make up something bigger rather than tunnels and holes that end in a destination.

The World Wide Web captured people’s imaginations, and then everything changed.

I was reminded of this while reading a recent interview with Tim Berners-Lee (via TechCrunch). He talked a bit about the power of linking data:

“Web 2.0 is a stovepipe system. It’s a set of stovepipes where each site has got its data and it’s not sharing it. What people are sometimes calling a Web 3.0 vision where you’ve got lots of different data out there on the Web and you’ve got lots of different applications, but they’re independent. A given application can use different data. An application can run on a desktop or in my browser, it’s my agent. It can access all the data, which I can use and everything’s much more seamless and much more powerful because you get this integration. The same application has access to data from all over the place…

Data is different from documents. When you write a document, if you write a blog, you write a poem, it is the power of the spoken word. And even if the website adds a lot of decoration, the really important thing is the spoken words. And it is one brain to another through these words.”

Data is what matters. It’s a point of interest in a larger context. It’s a vector and a launchpad to other paths. It’s the vehicle for leverage for a business on the Internet.

What’s the business strategy at the data layer?

I have mixed views on where the value is on social networks and the apps therein, but they are all showing where the opportunity is for services that have actually useful data. Social networks are a good user interface for distributed data, much like web browsers became a good interface for distributed documents.

But it’s not the data consumption experience that drives value, in my mind.

Value on the Internet is being created in the way data is shared and linked to more data. That value comes as a result of the simplicity and ease of access, in the completeness and timeliness, and by the readability of that data.

It’s not about posting data to a domain and figuring out how to get people there to consume it. It’s about being the best data source or the best data aggregator no matter how people make use of it in the end.

Where’s the money?

Like most Internet service models, there’s always the practice of giving away the good stuff for free and then upselling paid services or piggybacking revenue-generating services on the distribution of the free stuff. Chris Anderson’s Wired article on the future of business presents the case well:

“The most common of the economies built around free is the three-party system. Here a third party pays to participate in a market created by a free exchange between the first two parties…what the Web represents is the extension of the media business model to industries of all sorts. This is not simply the notion that advertising will pay for everything. There are dozens of ways that media companies make money around free content, from selling information about consumers to brand licensing, “value-added” subscriptions, and direct ecommerce. Now an entire ecosystem of Web companies is growing up around the same set of models.”

Yet these markets and technologies are still in very early stages. There’s lots of room for someone to create an open advertising marketplace for information, a marketplace where access to data can be obtained in exchange for ad inventory, for example.

Data providers and aggregators have a huge opportunity in this world if they can become authoritative or essential for some type of useful information. With that leverage they could have the social networks, behavioral data services and ad networks all competing to piggyback on their data out across the Internet to all the sites using or contributing to that data.

Regardless of the specific revenue method, the businesses that become a dependency in the Web of data of the future will also find untethered growth opportunities. The cost of that type of business is one of scale, a much more interesting place to be than one that must fight for attention.

I’ve never really liked the “walled garden” metaphor and its negative implications. I much prefer to think in terms of designing for growth.

Frank Lloyd Wright designed buildings that were engaged with the environments in which they lived. Similarly, the best services on the World Wide Web are those that contribute to the whole rather than compete with it, ones that leverage the strengths in the network rather than operate in isolation. Their existence makes the Web better as a whole.

Photo: happy via

Interactive journalism: An amazing homicide mashup

I had the pleasure of interviewing Sean Connelly and Katy Newton for YDN Theater recently with YDN videographer Ricky Montalvo. They created the amazing (and award-winning) crime data mashup Not Just A Number in partnership with The Oakland Tribune.

Not Just A NumberAfter getting tired of watching the homicide count for 2006 climb higher and higher, they decided to humanize the issue and talk to the families of the victims directly. They wanted to expose the story beneath the number and give a platform upon which the community could make the issue real.

Statistics can tell effective stories, but death and loss reach emotional depths beyond the power of any numerical exploration.

Sean and Katy posted recordings of the families talking about the sons, daughters, sisters and brothers that they lost. They integrated family photos, message boards, articles and more along with the interactive homicide map on the site to round out the experience making it much more human than the traditional crime data mashup.

Here is the video (7 min.):

I also asked them if they had trouble getting data to make the site, and they said the Oakland Tribune staff were very supportive. There weren’t any usable open data sets coming out of the city, so they had to collect and enter everything themselves.

This, of course, is a very manual process. Given the challenge of getting the data Sean and Katy didn’t see how the idea could possibly scale outside of the city of Oakland.

SOmebody needs to take that on as a challenge.

I’m hopeful that efforts like Not Just A Number and the Open Government Data organization will be able to surface why it’s important for our government to open up access to the many data repositories they hold. And if the government won’t do it, then it should be the job of journalists and media companies to surface government data so that people can use it in meaningful ways.

This is a great example of how the Internet can empower people who otherwise have no voice or audience despite having profound stories to tell.

Building markets out of data

I’m intrigued by the various ways people view ‘value’. There seem to be 2 camps: 1) people who view the world in terms of competition for finite resources and 2) people who see ways to create new forms of value and to grow the entire pie.

Umair Haque talks about choices companies make that push them into one of those 2 camps. He often argues that the market needs more builders than winners. He clarifies his position in his post The Economics of Evil:

“When you’re evil, your ability to co-create value implodes: because you make moves which are focused on shifting costs and extracting value, rather than creating it. …when you’re evil, the only game you want to – or can play – is domination.”

I really like the idea that the future of the media business is in the way we build value for all constituencies rather than the way we extract value from various parts of a system. It’s not about how you secure marketshare, control distribution, mitigate risk or reduce costs. It’s about how you enable the creation of value for all.

He goes on to explain how media companies often make the mistake of focusing on data ownership:

“Data isn’t the value. In fact, data’s a commodity…What is valuable are the things that create data: markets, networks, and communities.

Google isn’t revolutionizing media because it “owns the data”. Rather, it’s because Google uses markets and networks to massively amplify the flow of data relative to competitors.”

I would add that it’s not just the creation of valuable data that matters but also in the way people interface with existing data. Scott Karp’s excellent post on the guidelines for transforming media companies shares a similar view:

“The most successful media companies will be those that learn to how build networks and harness network effects. This requires a mindset that completely contradicts traditional media business practices. Remember, Google doesn’t own the web. It doesn’t control the web. Google harnesses the power of the web by analyzing how websites link to each other.”

The useful convergence of data

I have only one prediction for 2008. I think we’re finally about to see the useful combination of the 4 W’s – Who, What, Where, and When.

Marc Davis has done some interesting research in this area at Yahoo!, and Bradley Horowitz articulated how he sees the future of this space unfolding in a BBC article in June ’07:

“We do a great job as a culture of “when”. Using GMT I can say this particular moment in time and we have a great consensus about what that means…We also do a very good job of “where” – with GPS we have latitude and longitude and can specify a precise location on the planet…The remaining two Ws – we are not doing a great job of.”

I’d argue that the social networks are now really honing in on “who”, and despite having few open standards for “what” data (other than UPC) there is no shortage of “what” data amongst all the “what” providers. Every product vendor has their own version of a product identifier or serial number (such as Amazon’s ASIN, for example).

We’ve seen a lot of online services solving problems in these areas either by isolating specific pieces of data or combining the data in specific ways. But nobody has yet integrated all 4 in a meaningful way.


Jeff Jarvis’ insightful post on social airlines starts to show how these concepts might form in all kinds of markets. When you’re traveling it makes a lot of sense to tap into “who” data to create compelling experiences that will benefit everyone:

  • At the simplest level, we could connect while in the air to set up shared cab rides once we land, saving passengers a fortune.
  • We can ask our fellow passengers who live in or frequently visit a destination for their recommendations for restaurants, things to do, ways to get around.
  • We can play games.
  • What if you chose to fly on one airline vs. another because you knew and liked the people better? What if the airline’s brand became its passengers?
  • Imagine if on this onboard social network, you could find people you want to meet – people in the same business going to the same conference, people of similar interests, future husbands and wives – and you can rendezvous in the lounge.
  • The airline can set up an auction marketplace for at least some of the seats: What’s it worth for you to fly to Berlin next Wednesday?

Carrying the theme to retail markets, you can imagine that you will walk into H&M and discover that one of your first-degree contacts recently bought the same shirt you were about to purchase. You buy a different one instead. Or people who usually buy the same hair conditioner as you at the Walgreen’s you’re in now are switching to a different hair conditioner this month. Though this wouldn’t help someone like me who has no hair to condition.

Similarly, you can imagine that marketing messages could actually become useful in addition to being relevant. If CostCo would tell me which of the products I often buy are on sale as I’m shopping, or which of the products I’m likely to need given what they know about how much I buy of what and when, then my loyalty there is going to shoot through the roof. They may even be able to identify that I’m likely buying milk elsewhere and give me a one-time coupon for CostCo milk.

Bradley sees it playing out on the phone, too:

“On my phone I see prices for a can of soup in my neighbourhood. It resolves not only that particular can of soup but knows who I am, where I am and where I live and helps me make an intelligent decision about whether or not it is a fair price.

It has to be transparent and it has to be easy because I am not going to invest a lot of effort or time to save 13 cents.”

It may be unrealistic to expect that this trend will explode in 2008, but I expect it to at least appear in a number of places and inspire future implementations as a result. What I’m sure we will see in 2008 is dramatic growth in the behind-the-scenes work that will make this happen, such as the development and customization of CRM-like systems.

Lots of companies have danced around these ideas for years, but I think the ideas and the technologies are finally ready to create something real, something very powerful.

Photo: SophieMuc

The Internet’s secret sauce: surfacing coincidence

What is it that makes my favorite online services so compelling? I’m talking about the whole family of services that includes Dopplr, Wesabe, Twitter, Flickr, and del.icio.us among others.

I find it interesting that people don’t generally refer to any of these as “web sites”. They are “services”.

I was fortunate enough to spend some time with Dopplr’s Matt Biddulph and Matt Jones last week while in London where they described the architecture of what they’ve built in terms of connected data keys. The job of Dopplr, Mr. Jones said, was to “surface coincidence”.

I think that term slipped out accidentally, but I love it. What does it mean to “surface coincidence”?

It starts by enabling people to manufacture the circumstances by which coincidence becomes at least meaningful if not actually useful. Or, as Jon Udell put it years ago now when comparing Internet data signals to cellular biology:

“It looks like serendipity, and in a way it is, but it’s manufactured serendipity.”

All these services allow me to manage fragments of my life without requiring burdensome tasks. They all let me take my data wherever I want. They all enhance my data by connecting it to more data. They all make my data relevant in the context of a larger community.

When my life fragments are managed by an intelligent service, then that service can make observations about my data on my behalf.

Dopplr can show me when a distant friend will be near and vice versa. Twitter can show me what my friends are doing right now. Wesabe can show me what others have learned about saving money at the places where I spend my money. Among many other things Flickr can show me how to look differently at the things I see when I take photos. And del.icio.us can show me things that my friends are reading every day.

There are many many behaviors both implicit and explicit that could be managed using this formula or what is starting to look like a successful formula, anyhow. Someone could capture, manage and enhance the things that I find funny, the things I hate, the things at home I’m trying to get rid of, the things I accomplished at work today, the political issues I support, etc.

But just collecting, managing and enhancing my life fragments isn’t enough. And I think what Matt Jones said is a really important part of how you make data come to life.

You can make information accessible and even fun. You can make the vast pool feel manageable and usable. You can make people feel connected.

And when you can create meaning in people’s lives, you create deep loyalty. That loyalty can be the foundation of larger businesses powered by advertising or subscriptions or affiliate networks or whatever.

The result of surfacing coincidence is a meaningful action. And those actions are where business value is created.

Wikipedia defines coincidence as follows:

“Coincidence is the noteworthy alignment of two or more events or circumstances without obvious causal connection.”

This is, of course, similar and related to the definition of serendipity:

“Serendipity is the effect by which one accidentally discovers something fortunate, especially while looking for something else entirely.”

You might say that this is a criteria against which any new online service should be measured. Though it’s probably so core to getting things right that every other consideration in building a new online service needs to support it.

It’s probably THE criteria.

Making government more useful through data

A very interesting working group formed recently to drive better transparency in government through data. The Open Government Data organization has a simple aim:

“The group is offering a set of fundamental principles for open government data. By embracing the eight principles, governments of the world can become more effective, transparent, and relevant to our lives.”

They proposed that data will be considered open if it complies with the following qualifications:

1. Complete
2. Primary
3. Timely
4. Accessible
5. Machine processable
6. Non-discriminatory
7. Non-proprietary
8. License-free

This is a promising approach to driving high impact changes in the way government serves its people. Giving everyone greater access to relevant information that they already own is a noble pursuit.

I’ve explored this a little myself in some investigations of access to crime data [1, 2].

It’s no surprise that Adrian Holovaty of the Chicago Crime mashup fame (and now Every Block) is one of the founding members. Of course, there’s no better advocate for the free flow of information than Lawrence Lessig. And Tim O’Reilly will be a strong foundational force here. I’d love to see Jon Udell join, too, as his work has inspired a lot of people (myself included) to think differently about exposing and sharing data like this.

Good luck, guys!

Oakland Trib’s Not-Just-A-Number improves on crime data visualization

OJR’s Jim Wayne dives into Oakland Tribune’s “Not Just A Number” web site. The service won the Service Journalism Award from ONA for an amazingly powerful view of crime data.

The basic premise was to create a data visualization for Oakland homicide crime data that made the victims and, more importantly, the people in their lives real participants in the story rather than pure statistics (or just plain ignored entirely).

It’s a very powerful site and a model for all local newspapers to follow. It’s disappointing but no surprise the media creates these kinds of community services before local governments do. At least we’re getting more access to crime data.

Wayne also points to a crime data visualization from the Los Angeles Times called The Homicide Map that I wasn’t aware of.

They have a nice map mashup that takes a more statistical approach, yet they also include things like images of the victims.

Unfortunately, as Oakland Tribune producers Katy Newton and Sean Connelley point out, a mug shot is not a fair image to use for a violent crime victim in a statistical map. But I’m glad to see them exposing data that needs to be shared.

732 homicides in Los Angeles so far in 2007! Unbelievable.